Edit table layout - Areas
Select a table layout and a table based on example date is displayed right to the OfficeReports Layout pane.
Each Text and Value area in a table can now be customized in terms of font, font size, font color, fill color etc.:
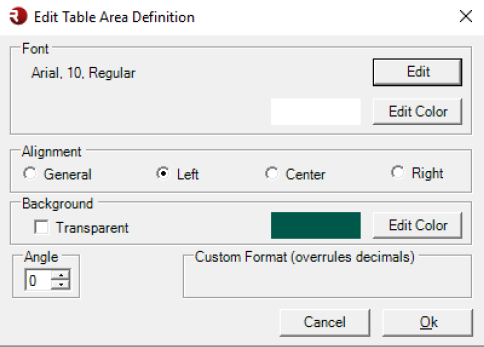
Texts:
Row 1, Row 2 (only cross) and Column 1
The text areas can be defined based on these settings :
Values
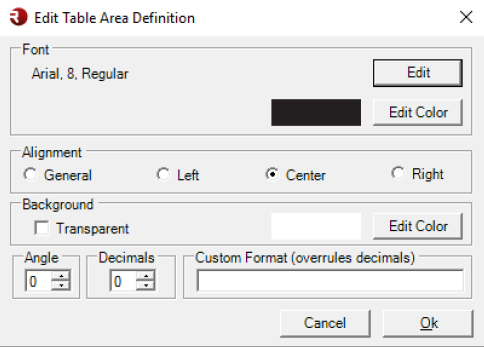
Count, Percentage, Base, Total, Mean, Std. Deviation
The value areas can be defined based on these settings:
- Font (size, style etc.)
- Font color
- Alignment
- fill color
- Angle
- Decimals
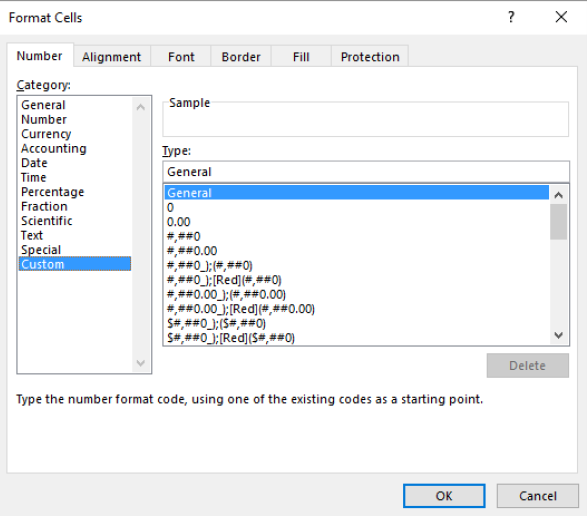
- Custom Format
ObserveCharacters added to show low/insufficient base and/or significance will be displyed to the right side of numbers, when using Center or Left alignment. Left side, when using Right alignment
Observe
By using Custom Format, you can define a layout where numbers always includes a ‘$’ or percentages should not include a percentage sign. You can use all the format settings as available in Excel ‘Custom format’: